VDH Opening

That’s how I read it too. I am so curious what this document is. It does not appear to be online.

This squares well with my expectation of 1-2 points less than VGC per night.
 
  • Like
Reactions: ehh
I'm not sure I know what this is trying to say. Is there more context? Is the "will always be eligible to reserve" saying that availability is unlimited? Is it saying the maximum points? The minimum points?

That number represents the points per night if points were allocated across every season and every night evenly.
 
Edit: one thing I did notice from this is that AK, SSR and BLT don't have points split into their categories like the other resorts do which is interesting. Did they not have separate categories when they first sold these resorts? It is interesting that all three of these were sold around the same time so maybe they did not have to put this info into the booklet
SSR did not have the view categories initially. I don't recall exactly when they were added - perhaps around 2014/15.

AKV and BLT did always have the view categories. By not listing them in the master documents it likely prevented any issues with changing what categories the rooms were in. That actually was done at both BLT and AKV.
 
That number represents the points per night if points were allocated across every season and every night evenly.
That sounds reasonable, but also doesn't quite line up with actual numbers.

What you're describing is the average points per night with correct weighting for number of nights in a season (and number of weekend/weekday, etc.). Basically the 'most correct' average. Fortunately, I have all of that in a spreadsheet already for 2023 points (and 2024, if needed) so I can easily compare.

Riviera has a few room categories off (especially PV 1BR) for both metrics:
MedianAverageBooklet
Tower1615.315
SV Deluxe1919.120
PV Deluxe2523.824
SV 1BR4140.440
PV 1BR5250.447
SV 2BR5352.954
PV 2BR6664.065
GV132130.4134

Poly looks great for both, average is dead-on:
MedianAverageBooklet
SV Deluxe2221.722
PV Deluxe2625.826
Bungalow149146.9147

Grand Cali is way off on both metrics, the average is closer:
MedianAverageBooklet
Studio2523.521
1BR5046.242
2BR6863.562
GV143132.9139

Copper Creek looks great for both, though median has less deviation from booklet:
MedianAverageBooklet
Studio1717.318
1BR3635.336
2BR4645.846
Cabin115114.4115
GV122120.7122

Old Key West is okay for both, though median is tad closer:
MedianAverageBooklet
Studio1513.415
1BR2828.230
2BR3938.540
GV6261.065


Some of the older resorts have had seasonal reallocations over the years, so some of the drift might be from that.

But with RIV and VGC both being off in the manners they are, I think some of these might just be 'reference' points that DVC picks as a typical points/night at some point in the points chart creation process and not rooted in any sort of calculation based on the real points chart. This can lead to differences from something like the points chart being adjusted after picking the reference numbers because they realized they should/could make tweaks to sell more points.

VGC strikes me as a realization that they ought to sell more points overall, with a tiny resort being even smaller without the adjusment. RIV strikes me as a little bit more evil-greedy, trying to cram more points into the calendar while also dropping SV Deluxe a tiny bit for increased buyer appeal (and now SV Deluxe is way more popular than the rest of the rooms, go figure).

Anyway, even though average isn't exactly a match, it's another strong correlation. Considering how strongly correlative VGF/Poly/CCV were to both median and average, I'm hopeful this means good things for the VDH chart as the listed numbers aren't bad.
What in the world do you do for a living that your brain functions this math-y:teacher:?! Interesting info and I have no idea how you can pull so much out of so little data to start with but amusing none the less.
 
That sounds reasonable, but also doesn't quite line up with actual numbers.

What you're describing is the average points per night with correct weighting for number of nights in a season (and number of weekend/weekday, etc.). Basically the 'most correct' average. Fortunately, I have all of that in a spreadsheet already for 2023 points (and 2024, if needed) so I can easily compare.

Riviera has a few room categories off (especially PV 1BR) for both metrics:
MedianAverageBooklet
Tower1615.315
SV Deluxe1919.120
PV Deluxe2523.824
SV 1BR4140.440
PV 1BR5250.447
SV 2BR5352.954
PV 2BR6664.065
GV132130.4134

Poly looks great for both, average is dead-on:
MedianAverageBooklet
SV Deluxe2221.722
PV Deluxe2625.826
Bungalow149146.9147

Grand Cali is way off on both metrics, the average is closer:
MedianAverageBooklet
Studio2523.521
1BR5046.242
2BR6863.562
GV143132.9139

Copper Creek looks great for both, though median has less deviation from booklet:
MedianAverageBooklet
Studio1717.318
1BR3635.336
2BR4645.846
Cabin115114.4115
GV122120.7122

Old Key West is okay for both, though median is tad closer:
MedianAverageBooklet
Studio1513.415
1BR2828.230
2BR3938.540
GV6261.065


Some of the older resorts have had seasonal reallocations over the years, so some of the drift might be from that.

But with RIV and VGC both being off in the manners they are, I think some of these might just be 'reference' points that DVC picks as a typical points/night at some point in the points chart creation process and not rooted in any sort of calculation based on the real points chart. This can lead to differences from something like the points chart being adjusted after picking the reference numbers because they realized they should/could make tweaks to sell more points.

VGC strikes me as a realization that they ought to sell more points overall, with a tiny resort being even smaller without the adjusment. RIV strikes me as a little bit more evil-greedy, trying to cram more points into the calendar while also dropping SV Deluxe a tiny bit for increased buyer appeal (and now SV Deluxe is way more popular than the rest of the rooms, go figure).

Anyway, even though average isn't exactly a match, it's another strong correlation. Considering how strongly correlative VGF/Poly/CCV were to both median and average, I'm hopeful this means good things for the VDH chart as the listed numbers aren't bad.

If the charts were the same every night, there are no more seasons.

So, it’s just based in 365 days a year. Or am not understanding your post.
 
Could you expand on your thought process? I find it very interesting.
VGC has 1.136mil points. Currently the median pts/night is 25/50/68/143, by room category. If DVC had actually used 21/42/62/139 as their 'typical' pts/night instead, VGC would have had something like 90-100k fewer points, roughly an 8% reduction.

Speculation: considering how small it is and whatever they were forecasting for how long sales would take (trying to dovetail into Aulani sales beginning), I wouldn't be surprised if they realized fairly late in the process "we need to add more points" to make it last until Aulani and then deviated from the 21/42/62/139 plan, which had already been sent to printing for the Booklet.

Or maybe they just realized late they were under-pricing a premium product.

Then the recession magnified and VGC sold much slower than expected 😅

If the charts were the same every night, there are no more seasons.

So, it’s just based in 365 days a year. Or am not understanding your post.
Sorry for any confusion. We actually might be describing the same thing.

In that post I'm trying to characterize the points in the Booklet and determine if there's a mathematical process used involving a full Points Chart as input to reach the Booklet points. The idea being is that if there were one, maybe it could be reversed and we could get a fairly high confidence preview of the VDH Points Chart based on the Booklet points.

KAT4DISNEY described the Booklet points as a specific type of average, though with different wording.

There's different ways to calculate "average". The quick/dirty way to calculate the average number of points per night is to just average the numbers shown on the points chart. This is how I calculated "median", admittedly (but median instead of mean). This is the incorrect way to do it.

It's incorrect because different seasons have different number of days, and there's ~2.5x as many weekday nights as weekend nights. This can get particularly nasty with averages where the distribution is very uneven or there are outlier values that really skew the result.

A better way to calculate average is to count the number of weekday and weekend nights in each season, and multiply by the respective pts/night for that season. Do it for every season and this gets you total number of points in a year, which you can divide by 365 (or 366 next year) to get the 'most correct' average. It's just a properly weighted average. This is what KAT4DISNEY described very concisely (I think). The average numbers listed in the tables above are done using that methodology.

Another way to describe this method is "the average number of points per night you would spend if you were to book the same room for an entire year". I think this might be what you're saying, too.

Because the properly weighted average doesn't match what DVC lists in the Booklet (sometimes more than just rounding differences), it's unlikely that the Booklet actually lists the average points per night using this process for every resort.

I'm skeptical there is even a single mathematical process that describes all the Booklet's point values vs. 2023 point charts. It seems the Booklet might use original points charts, before any reallocations over the years. Additionally, the Riviera listing is an oddball compared to other recent listings. Poly/CCV are really accurately represented in the Booklet, Riviera not so much.

Because there is likely no single mathematical process, I label them as 'reference' points. Where it describes a typical pt/night, but not any specific night or any real mathematical representation of average pt/night.

Another way to think about it is that the numbers in the Booklet are some handwavey 'center point' of the Points Chart, and then the Points Chart spreads out from there. By establishing the center point in this Booklet they allow themselves maximum reallocation flexibility later.

In my post, I attribute the Riviera deviation from the Booklet due to late changes to the Points Chart, with the assumption that Booklet numbers go to printing before the Points Chart is published online, as is the case with VDH. Then I speculate on cause of the deviation.

(this is a wall of text, I'm sorry)
 
VGC has 1.136mil points. Currently the median pts/night is 25/50/68/143, by room category. If DVC had actually used 21/42/62/139 as their 'typical' pts/night instead, VGC would have had something like 90-100k fewer points, roughly an 8% reduction.

Speculation: considering how small it is and whatever they were forecasting for how long sales would take (trying to dovetail into Aulani sales beginning), I wouldn't be surprised if they realized fairly late in the process "we need to add more points" to make it last until Aulani and then deviated from the 21/42/62/139 plan, which had already been sent to printing for the Booklet.

Or maybe they just realized late they were under-pricing a premium product.

Then the recession magnified and VGC sold much slower than expected 😅


Sorry for any confusion. We actually might be describing the same thing.

In that post I'm trying to characterize the points in the Booklet and determine if there's a mathematical process used involving a full Points Chart as input to reach the Booklet points. The idea being is that if there were one, maybe it could be reversed and we could get a fairly high confidence preview of the VDH Points Chart based on the Booklet points.

KAT4DISNEY described the Booklet points as a specific type of average, though with different wording.

There's different ways to calculate "average". The quick/dirty way to calculate the average number of points per night is to just average the numbers shown on the points chart. This is how I calculated "median", admittedly (but median instead of mean). This is the incorrect way to do it.

It's incorrect because different seasons have different number of days, and there's ~2.5x as many weekday nights as weekend nights. This can get particularly nasty with averages where the distribution is very uneven or there are outlier values that really skew the result.

A better way to calculate average is to count the number of weekday and weekend nights in each season, and multiply by the respective pts/night for that season. Do it for every season and this gets you total number of points in a year, which you can divide by 365 (or 366 next year) to get the 'most correct' average. It's just a properly weighted average. This is what KAT4DISNEY described very concisely (I think). The average numbers listed in the tables above are done using that methodology.

Another way to describe this method is "the average number of points per night you would spend if you were to book the same room for an entire year". I think this might be what you're saying, too.

Because the properly weighted average doesn't match what DVC lists in the Booklet (sometimes more than just rounding differences), it's unlikely that the Booklet actually lists the average points per night using this process for every resort.

I'm skeptical there is even a single mathematical process that describes all the Booklet's point values vs. 2023 point charts. It seems the Booklet might use original points charts, before any reallocations over the years. Additionally, the Riviera listing is an oddball compared to other recent listings. Poly/CCV are really accurately represented in the Booklet, Riviera not so much.

Because there is likely no single mathematical process, I label them as 'reference' points. Where it describes a typical pt/night, but not any specific night or any real mathematical representation of average pt/night.

Another way to think about it is that the numbers in the Booklet are some handwavey 'center point' of the Points Chart, and then the Points Chart spreads out from there. By establishing the center point in this Booklet they allow themselves maximum reallocation flexibility later.

In my post, I attribute the Riviera deviation from the Booklet due to late changes to the Points Chart, with the assumption that Booklet numbers go to printing before the Points Chart is published online, as is the case with VDH. Then I speculate on cause of the deviation.

(this is a wall of text, I'm sorry)

I just looked at is as taking the maximum reallocation number in the POS and multiplying by 365. Those totals for each room type should match declared points that were sold.
 
I just looked at is as taking the maximum reallocation number in the POS and multiplying by 365. Those totals for each room type should match declared points that were sold.
We're describing the same thing. It doesn't always match. Sometimes the difference is roughly a rounding inaccuracy, sometimes some drift due to reallocation over the years, other times it's bigger (like a few categories at RIV, or all of VGC).

EDIT: I suppose I should look at the 2020 RIV points chart, before the switch to 7 seasons. I wonder if they snuck in some category reallocation in the 2021/2022 changes.
 
Last edited:
We're describing the same thing. It doesn't always match. Sometimes the difference is roughly a rounding inaccuracy, sometimes some drift due to reallocation over the years, other times it's bigger (like a few categories at RIV, or all of VGC).

EDIT: I suppose I should look at the 2020 RIV points chart, before the switch to 7 seasons. I wonder if they snuck in some category reallocation in the 2021/2022 changes.

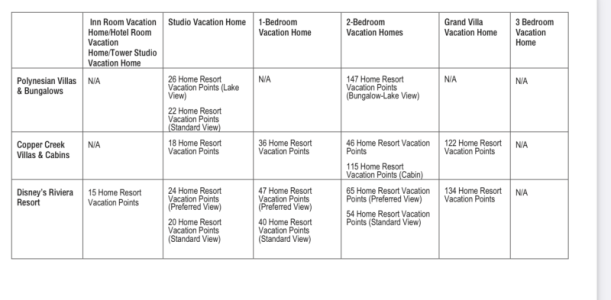
I guess I am just not understanding what the seasons have to do with it. The chart in the back of the Multi-site lists exactly what it would be If all flattened out. This the the chart. It’s just the page with RIV..there are other pages with the other resorts.

Example, the tower studio is 15 points..for 365 days that’s 5475 points for each unit…and there are 36 rooms…total is 197,100

So, you’d do that for each room type in the chart and add It up…for studios and one bedrooms it would be only the ones dedicated…

Are you saying you did your calculations od this chart and it doesn’t work? Also, points charts include the lock off premium….


1681514908130.png
 
I guess I am just not understanding what the seasons have to do with it. The chart in the back of the Multi-site lists exactly what it would be If all flattened out. This the the chart. It’s just the page with RIV..there are other pages with the other resorts.

Example, the tower studio is 15 points..for 365 days that’s 5475 points for each unit…and there are 36 rooms…total is 197,100

So, you’d do that for each room type in the chart and add It up…for studios and one bedrooms it would be only the ones dedicated…

Are you saying you did your calculations od this chart and it doesn’t work? Also, points charts include the lock off premium….


View attachment 753327
Yes, I'm saying I added up the actual points for each day of the year, which requires knowing the seasons, and it does not match that chart for RIV. It's really close for Poly/CCV though.

Lock-offs don't matter in this, I'm not calculating full resort points, just the number of points for a single room in each category for all days in the year (then dividing by the number of days in a year).

It looks like my earlier speculation about maybe the RIV 2020 Points Chart is closer to the Booklet was unfounded. It has basically the same mismatches.

Here's a breakdown of actual points vs. what the Booklet shows for Riviera:
Actual 2020 Points for 1 room, full yearActual 2024 Points for 1 room, full yearBooklet multiplied by 366 (both are Leap Year)
Tower5,809 - 15.87/day5,619 - 15.35/day5,490 - 15/day
SV Deluxe7,245 - 19.80/day6,982 - 19.08/day7,320 - 20/day
PV Deluxe8,808 - 24.07/day8,719 - 23.82/day8,784 - 24/day
SV 1BR15,019 - 41.04/day14,813 - 40.47/day14,640 - 40/day
PV 1BR18,486 - 50.51/day18,461 - 50.44/day17,202 - 47/day
SV 2BR19,312 - 52.77/day19,384 - 52.96/day19,764 - 54/day
PV 2BR23,372 - 63.86/day23,424 - 64.00/day23,790 - 65/day
Grand Villa47,929 - 130.95/day47,741 - 130.44/day49,044 - 134/day

These aren't rounding errors/choices like in CCV/Poly, a handful of these are just kind of off, especially PV 1BR.
Are you telling me that if I buy 6000 DVC points I can live at the Riviera year round? 🤔
 
Yes, I'm saying I added up the actual points for each day of the year, which requires knowing the seasons, and it does not match that chart for RIV. It's really close for Poly/CCV though.

Lock-offs don't matter in this, I'm not calculating full resort points, just the number of points for a single room in each category for all days in the year (then dividing by the number of days in a year).

It looks like my earlier speculation about maybe the RIV 2020 Points Chart is closer to the Booklet was unfounded. It has basically the same mismatches.

Here's a breakdown of actual points vs. what the Booklet shows for Riviera:
Actual 2020 Points for 1 room, full yearActual 2024 Points for 1 room, full yearBooklet multiplied by 366 (both are Leap Year)
Tower5,809 - 15.87/day5,619 - 15.35/day5,490 - 15/day
SV Deluxe7,245 - 19.80/day6,982 - 19.08/day7,320 - 20/day
PV Deluxe8,808 - 24.07/day8,719 - 23.82/day8,784 - 24/day
SV 1BR15,019 - 41.04/day14,813 - 40.47/day14,640 - 40/day
PV 1BR18,486 - 50.51/day18,461 - 50.44/day17,202 - 47/day
SV 2BR19,312 - 52.77/day19,384 - 52.96/day19,764 - 54/day
PV 2BR23,372 - 63.86/day23,424 - 64.00/day23,790 - 65/day
Grand Villa47,929 - 130.95/day47,741 - 130.44/day49,044 - 134/day

These aren't rounding errors/choices like in CCV/Poly, a handful of these are just kind of off, especially PV 1BR.

The charts though include the lock off premium and you have to compare to the base year when looking at the charts…so, if there are more weekends in one year, or seasonal shifts it will change the things we see on actual charts …

You also can’t count leap year because they don’t sell for 366 days…DVC uses for 365 and actually only sells 51weeks as they keep the other as required by law…

When there is a leap year, you have extra points in the charts…the chart I posted should match the total declared points…and then charts are created from there.

So, compare it only to 365…and the whole point of the maximum chart is to show what it would be with no differences..

When you look at the actual charts, you have to account for the differences that are calendar and have to discount them because they can add more points…for example. like I said, leap year will.

But, I am going to admit I don’t really understand what you are trying to do…so I am sure it’s me. Lol


DIS Facebook DIS youtube DIS Instagram DIS Pinterest DIS Tiktok DIS Twitter

Back
Top