Nothing else in Sweden is killing 100 people a day. For the last 10 years, Sweden averages just 250 deaths a day. Corona Virus has increased the number of people dying there a day by 40%. That's not normal.
Here is a report on SARS Vaccine testing. What you're talking about is a secondary TH2 immunopathologic response triggered by exposure to the SARS virus in vaccinated lab animals. This happened at very early stages of testing and it's something they were more or less expecting. The vaccines caused the TH2 response in some of the mice types used, the primates, and the ferrets. Some of the vaccines tested did not provoke this response in some mice and the hamsters. All of the vaccines induced protection against SARS-Coronavirus.
It could be
quite a bit higher. Maybe R0 value of over 5 compared to 1.3 of flu.
This is why there is so much push to re-open the country. There are huge financial interests that need the rest of us to get back to work. They want us unable to refuse to put ourselves at greater risk.
Well, they are
getting it pretty bad.
I lived in Brooklyn for 2 years, I can think of two things. First, Brooklyn and Queens both have airports, so increased contact with foreign travelers. Second, the median income and just the nature of work done in Manhattan means a larger portion are able to work from home.
Right, we just let everyone hurry up and get it and no big deal, it's just a virus killing 14,000 in LA. Is that the thinking here? Lock the old and disabled into sick wards and let a quarter million (assuming a much lower fatalaty rate once the old people are written off) of the rest of us die?
Most of us do what we must to survive and take risks to support that end. That's a part of life we all accept. But when what we do puts others at risk we have a greater responsibility to do them only when necessary.
The flu is a horrible comparison because you become symptomatic within a day or so and when one does get ill it is only the most horrible among us that continue to go out and about. And we have a vaccine for the flu that usually does a pretty good job of reducing the transmission of the most dangerous seasonal flu strains.
The
CDC says that so far this flu season (a particularly bad one) we're averaging about 65 deaths a day from the flu. That's the whole country. At the peak of this flu season, we were losing 583 people a WEEK. In 2018 (an even worse flu season) the most deaths we had was 1600 in a WEEK.
Nearly 2000 people died yesterday from covid19. We're averaging over 2k dead a DAY from covid19.
This is a ridiculous comparison.
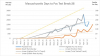
This is what a downward trajectory looks like:
View attachment 489738
That spot between April 7 and 11... that's the point where China lifted its lockdown.
Here's what we have:
View attachment 489739