ehh
the sound a shrug makes
- Joined
- Aug 3, 2019
- Messages
- 1,527
With the release of the VDH cash rack rates yesterday, Disney provided our first meaningful glimpse into how they perceive the value of these rooms.
I also know that people have been very itchy for an official Points Chart, so I thought I might be able to scratch that itch based on the rack rate data available and a little bit of math.
I debated posting this because whatever Points Chart(s) I post will be wrong, 100% guaranteed. But I hope people will understand the directional value of this kind of speculation. I'd like to think the info below could reduce the uncertainty around what to expect from the upcoming official Points Chart. Maybe someone's mindset moves from "it could be anything!" to "it's probably somewhere around [these values]". Hopefully a little less catastrophizing about bad Points Charts, but also hopefully a little less wishcasting about over-optimistic Points Charts.
First, some methodology:
Expected problems with this approach:
Apologies for the wall of text, but I felt the context of how this was done and why it will be wrong (but may be close) was important.
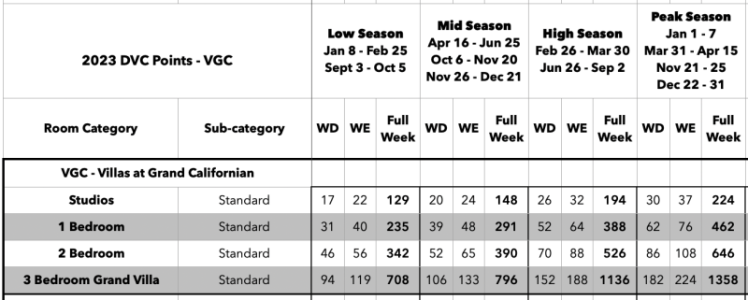
One note: these are 2023 Speculative Points Charts because there are ~no 2024 rack rates. VGC 2024 Points Chart is only different from VGC 2023 Points Chart based on which dates land in which Season (with the key differences being around Thanksgiving and Spring Break). Points/Night in any given Season are the same.
Without further adieu, here's the two Speculative Points Charts!
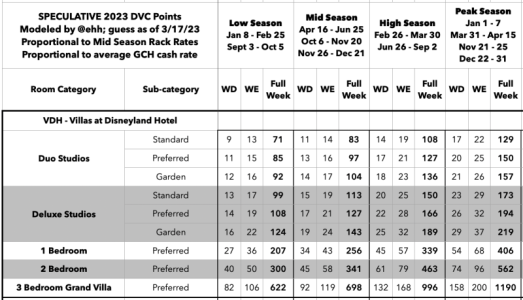
Lower Bound Points Chart: VGC cash rate is equivalent to the average of the cash rates of the various GCH view categories.

This is the lower of the two Points Charts and what I would consider a decent approximation of the lower bounds. This Points Chart would result in ~2.9mil points using the same 331/350 rooms as the original plan.
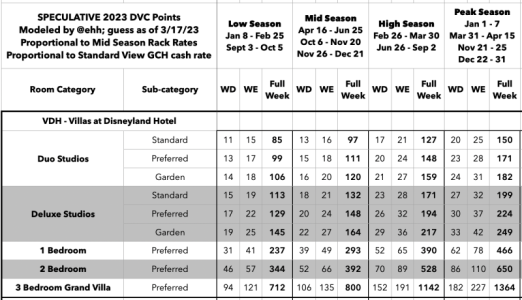
Upper Bounds Points Chart: VGC cash rate is equivalent to the cash rates of the Standard View GCH view category.
I consider this the upper bounds of the two. It worked out such that the PV Deluxe Studios are identical to VGC Studios. My personal opinion is this is the less likely of the two. Maybe Garden rooms are close, but I think everything else is a little too high. This Points Chart would result in ~3.3mil points using the same 331/350 rooms as the original plan.
I also know that people have been very itchy for an official Points Chart, so I thought I might be able to scratch that itch based on the rack rate data available and a little bit of math.
I debated posting this because whatever Points Chart(s) I post will be wrong, 100% guaranteed. But I hope people will understand the directional value of this kind of speculation. I'd like to think the info below could reduce the uncertainty around what to expect from the upcoming official Points Chart. Maybe someone's mindset moves from "it could be anything!" to "it's probably somewhere around [these values]". Hopefully a little less catastrophizing about bad Points Charts, but also hopefully a little less wishcasting about over-optimistic Points Charts.
First, some methodology:
- I gathered all the rack rates of VDH and most GCH rooms (everything but the named suites) between October 1, 2023 and December 31, 2023...as well as some early 2024 data where available.
- I made two sets of assumptions about the cash value of VGC rooms as there are no cash rates publicly available, which will result in two separate Points Charts below
- Assumption 1: a VGC Deluxe Studio (which has only one view) is equivalent to the average GCH Hotel Room view cost
- This ends up averaging out to between "Woods-Courtyard" and "Partial" views, closer to "Partial"
- Assumption 2: a VGC Deluxe Studio is equivalent to a Standard View GCH Hotel Room
- Note: I tried using all GCH room types (Hotel rooms and 1-3BR suites) at first but the Suite value was so disproportionate to Villa value that I decided to focus on the Hotel room/Deluxe Studio comparison instead
- Assumption 1: a VGC Deluxe Studio (which has only one view) is equivalent to the average GCH Hotel Room view cost
- I then took those assumed cash values for VGC and divided by points per night to get two sets of $ per Point
- I then broke those $ per Point data sets into seasons that match the DVC seasons and weekend/weekdays between Oct 1 and Dec 31 and averaged them
- Note: I initially tried using all dates from Oct 1 to Dec 31, but DVC and cash rates have pretty different dynamic range, especially at the holidays. This resulted in very low peak points chart for VDH at the holidays. Ultimately, I ended up using just the rack rates that overlap with VGC's 'Season 2', which has significant overlap between October - December
- I took that seasonal average $ per Point and multiplied it by the average VDH rack rate per night for each 'corresponding' room, at this point just VDH Deluxe Studios and GCH Hotel rooms, and just in 'Season 2' dates
- I now had two solid, well-reasoned Points Charts for VDH Deluxe Studios in Season 2
- I then extrapolated to cover the other room categories using cash rates for Duo Studios and the VGC relationship between Studios/Villas (assuming Preferred view VDH Studio was the proper match for VDH 1BR/2BR/GV, which are all Preferred view)
- I then proportionally extrapolated from Season 2 to Seasons 1, 3, and 4 using VGC Points Chart relationship between seasons
Expected problems with this approach:
- There's three key extrapolations using assumptions here, any of which could be very incorrect:
- Duo Studios Pts/Night are proportional to their cash rates compared to Deluxe Studios
- IIRC, this has proven to be somewhat untrue at Riviera when looking at Tower vs. Deluxe cash rates
- Larger Villas at VDH will be proportionally similar to VGC, based on PV Deluxe Studios
- Seasons 1, 3, and 4 will be proportionally similar at VDH as they are at VGC
- Duo Studios Pts/Night are proportional to their cash rates compared to Deluxe Studios
- Cash values are never perfectly aligned with DVC points values (but they are useful directionally)
- This is why I had to discard all non-Season 2 cash rates, because the resulting Points Charts were nonsensical when using all the data
- This is also especially true within a room category but across view categories. Look at Riviera Standard vs. Preferred, where the points difference is larger than the cash difference
- 'Hand tweaks' to the charts will obviously be missed, even if everything else is correct. Potential hand tweaks:
- DVC may want a really low Pts/Night for the minimum value in a Duo Studio for marketing/sales pitches (e.g., "You could stay here 5 nights with just 40 points!")
- Garden rooms are a crapshoot with how few there are, they could really dial up the points on those
- Considering how few 1BR/2BR/GV Villas there are, they might also dial up the points on those, too
Apologies for the wall of text, but I felt the context of how this was done and why it will be wrong (but may be close) was important.
One note: these are 2023 Speculative Points Charts because there are ~no 2024 rack rates. VGC 2024 Points Chart is only different from VGC 2023 Points Chart based on which dates land in which Season (with the key differences being around Thanksgiving and Spring Break). Points/Night in any given Season are the same.
Without further adieu, here's the two Speculative Points Charts!
Lower Bound Points Chart: VGC cash rate is equivalent to the average of the cash rates of the various GCH view categories.

This is the lower of the two Points Charts and what I would consider a decent approximation of the lower bounds. This Points Chart would result in ~2.9mil points using the same 331/350 rooms as the original plan.
Upper Bounds Points Chart: VGC cash rate is equivalent to the cash rates of the Standard View GCH view category.

I consider this the upper bounds of the two. It worked out such that the PV Deluxe Studios are identical to VGC Studios. My personal opinion is this is the less likely of the two. Maybe Garden rooms are close, but I think everything else is a little too high. This Points Chart would result in ~3.3mil points using the same 331/350 rooms as the original plan.


