Interesting observation, I had never thought of that!One thing to consider then those in a location with a hotel location vs DVC only.
Someplace like RIV is all DVC so it’s operating costs will always be in complete control of owners.
Someplace like VGF has shared expenses that are in the control of the hotel. So, in those cases, there are potential expenses that will be shared and owners would have the same level of say.
You are using an out of date browser. It may not display this or other websites correctly.
You should upgrade or use an alternative browser.
You should upgrade or use an alternative browser.
The biggest owner question that is not given enough thought: future of maintenance fees...
- Thread starter Pluto777
- Start date
Cast a Stone said that someone with construction experience might be a good person to comment on this thread.. any construction folks out there? As far as CFW, I think what shocked many is that they are STARTING with such high MF's. Usually when DVC brings a new resort they try to keep the MF's low (at least from the start), to encourage new buyers. I also think CFW is a completely different type of DVC for another reason.I'm not going to spend too much mental energy on it personally, since it depends on many factors that would be impossible for us to know or predict. Nobody predicted the crazy high MF for CFW, for example. Riviera was one of the highest when it opened, and most predicted it would outpace other resorts because of the skyliner, etc. But only a few years later it's basically average for WDW resorts.
I certainly wouldn't trust my or someone else's predictions enough to factor into any buying decisions
While I have a small bit of construction experience (VERY small) and I am no expert, CFW are not actually permanent structures with a foundation but rather modular. As you probably know, unlike homes/buildings with a solid built in foundation, modular or mobile homes depreciate rather than appreciate over time. Maybe this why the MF's are so high (MAYBE)?
I may understand a section of Monorail or Skyliner responsibility, but Just because the boat or bus STOPS somewhere, the owners are on the hook for MF's? Seems to me that a bus can stop ANYWHERE and change routes (as can a boat if a resort is near water).My understanding is that costs for transportation would be part of something that owners, since we do have the use of them, are on the hook to cover in a shared way.
So, for RIv, it’s the Skyliner and buses…for MK it’s monorail, boats and buses.
Now I could understand the bus stop or dock itself being billed to the resort, but how much does it cost to build and maintain a dock (or a bus stop)? IMO it does not seem like a great deal of money..
- Joined
- Apr 29, 2004
- Messages
- 39,181
I'm not sure I understand what you are saying. In general if the option to take a particular form of transportation is available to the guests of a particular resort then they will bear some of the cost to provide it. That cost is typically allocated based on guest capacity at each resort.I may understand a section of Monorail or Skyliner responsibility, but Just because the boat or bus STOPS somewhere, the owners are on the hook for MF's? Seems to me that a bus can stop ANYWHERE and change routes (as can a boat if a resort is near water).
Now I could understand the bus stop or dock itself being billed to the resort, but how much does it cost to build and maintain a dock (or a bus stop)? IMO it does not seem like a great deal of money..
I meant that being on the monorail loop is something permanent, but a bus or boat can always be redirected.I'm not sure I understand what you are saying. In general if the option to take a particular form of transportation is available to the guests of a particular resort then they will bear some of the cost to provide it. That cost is typically allocated based on guest capacity at each resort.
In any case, maybe we should all just simply look at the years of C.A.G.R. since the inception of each resort. When we do, there are some surprises. The 5 worst INSIDE WDW are: 1) BLT at 5.2%, 2) OKW at 4.5% 3 & 4) AKV and BRV and 5) SSR at 3.9%
Cabius
More Disney-obsessed than is healthy.
- Joined
- Nov 22, 2017
- Messages
- 1,574
I don't know about projecting accurately but I've done some work on tracking historic MF changes.Hey folks, just throwing this out there but while some properties are more obviously susceptible to M.F. increases (beachfront resorts for example), what about the resorts INSIDE WDW? I asked this years ago and there was some speculation, but now in 2024 we have a lot more data even on some of the newer resorts (PVB, GFV etc). The question is of all the certain types of construction on the WDW property say towers (BLT) vs bungalows (PVB) or larger type buildings (GFV, BWV, BCV, BRV, CCR, AKV) vs spread out type buildings (OKW, SSR), which is the best AND worst in terms of M.F. increases over the long term (5-10 + years)?
I would love to know if anyone out there (and I am thinking of some of the big number crunchers out there on this board fam - you know who you are ; ) has analyzed the past M.F. increases based on this and thus can project most accurately what likely increases will be in the future based on this factor. IMO, this is critical to determining best value but is so often overlooked.
Feel free to take a look at my Google Sheet -- and make your own copy if you want! I'll summarize some of the data and include some charts here, but they'll be blurry, so you can click-through for higher-resolution versions, and make your own copy to play around with variables.
https://docs.google.com/spreadsheets/d/12UuW8kj1JsUG-M16dHppNFc_in0Mic-b5qpszwZ17vY/edit?usp=sharing
The 'Detail' page tracks annual changes for each resort and calculates the historic Compound Annual Growth Rate (CAGR). For resorts that have been open long enough, it also splits out the CAGR for the first five years, last five years, and middle years (excluding first five and last five). At most resorts the growth rate is slow for the first 4-5 years before there are material increases, so that's there as a reminder not to look at a limited dataset and assume that, for example, RIV will always have due increases half the WDW average.
View attachment 877128
There are also some visualizations of changes per resort.
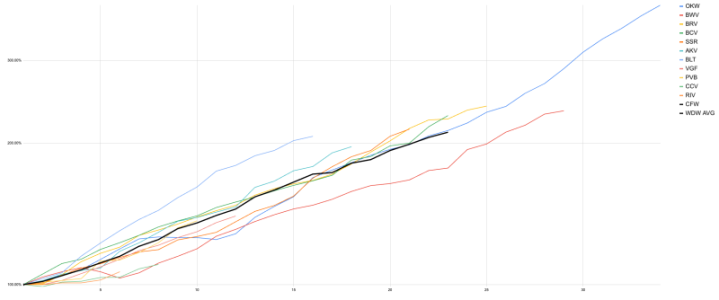
This chart shows the % change by year, so you can see how much dues at each resort have grown since opening. This visualizes how BLT dues growth has been significantly above-average, doubling in its first 15 years. BWV has been consistently below-average, taking 25 years to double its opening dues. SSR saw relatively little dues growth through the first 15 years, but is now somewhat above-average relative to opening-year dues.
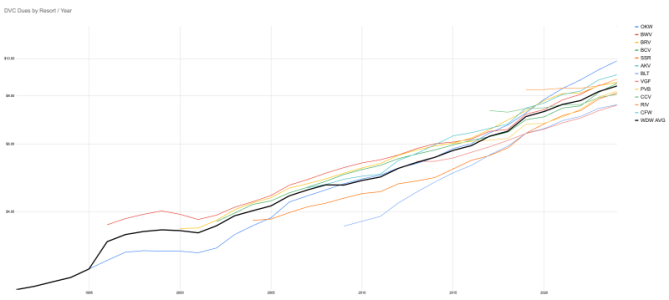
This chart shows the dues in dollars, from each resort's opening to the current year, along with an average (black line).
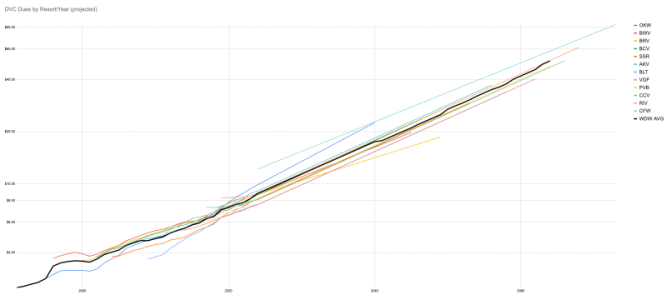
This chart projects dues (in dollars, log scale) out to the end of each resort. This uses the "Proj. CAGR" value for each resort in the Detail slide (row 45), which is something I just filled in as a guess based on historic data, usually in the 4.0% to 4.5% range. Obviously there's no chance these will end up being perfect straight lines, but it gives a rough idea of what you're in for.
VGCgroupie
Im in this photo
- Joined
- May 29, 2017
- Messages
- 10,294
LOVE this. Thank youI don't know about projecting accurately but I've done some work on tracking historic MF changes.
Feel free to take a look at my Google Sheet -- and make your own copy if you want! I'll summarize some of the data and include some charts here, but they'll be blurry, so you can click-through for higher-resolution versions, and make your own copy to play around with variables.
https://docs.google.com/spreadsheets/d/12UuW8kj1JsUG-M16dHppNFc_in0Mic-b5qpszwZ17vY/edit?usp=sharing
The 'Detail' page tracks annual changes for each resort and calculates the historic Compound Annual Growth Rate (CAGR). For resorts that have been open long enough, it also splits out the CAGR for the first five years, last five years, and middle years (excluding first five and last five). At most resorts the growth rate is slow for the first 4-5 years before there are material increases, so that's there as a reminder not to look at a limited dataset and assume that, for example, RIV will always have due increases half the WDW average.
View attachment 877128
There are also some visualizations of changes per resort.
This chart shows the % change by year, so you can see how much dues at each resort have grown since opening. This visualizes how BLT dues growth has been significantly above-average, doubling in its first 15 years. BWV has been consistently below-average, taking 25 years to double its opening dues. SSR saw relatively little dues growth through the first 15 years, but is now somewhat above-average relative to opening-year dues.
View attachment 877132
This chart shows the dues in dollars, from each resort's opening to the current year, along with an average (black line).
View attachment 877133
This chart projects dues (in dollars, log scale) out to the end of each resort. This uses the "Proj. CAGR" value for each resort in the Detail slide (row 45), which is something I just filled in as a guess based on historic data, usually in the 4.0% to 4.5% range. Obviously there's no chance these will end up being perfect straight lines, but it gives a rough idea of what you're in for.
View attachment 877134
WOW! FanTASTIC!!I don't know about projecting accurately but I've done some work on tracking historic MF changes.
Feel free to take a look at my Google Sheet -- and make your own copy if you want! I'll summarize some of the data and include some charts here, but they'll be blurry, so you can click-through for higher-resolution versions, and make your own copy to play around with variables.
https://docs.google.com/spreadsheets/d/12UuW8kj1JsUG-M16dHppNFc_in0Mic-b5qpszwZ17vY/edit?usp=sharing
The 'Detail' page tracks annual changes for each resort and calculates the historic Compound Annual Growth Rate (CAGR). For resorts that have been open long enough, it also splits out the CAGR for the first five years, last five years, and middle years (excluding first five and last five). At most resorts the growth rate is slow for the first 4-5 years before there are material increases, so that's there as a reminder not to look at a limited dataset and assume that, for example, RIV will always have due increases half the WDW average.
View attachment 877128
There are also some visualizations of changes per resort.
This chart shows the % change by year, so you can see how much dues at each resort have grown since opening. This visualizes how BLT dues growth has been significantly above-average, doubling in its first 15 years. BWV has been consistently below-average, taking 25 years to double its opening dues. SSR saw relatively little dues growth through the first 15 years, but is now somewhat above-average relative to opening-year dues.
View attachment 877132
This chart shows the dues in dollars, from each resort's opening to the current year, along with an average (black line).
View attachment 877133
This chart projects dues (in dollars, log scale) out to the end of each resort. This uses the "Proj. CAGR" value for each resort in the Detail slide (row 45), which is something I just filled in as a guess based on historic data, usually in the 4.0% to 4.5% range. Obviously there's no chance these will end up being perfect straight lines, but it gives a rough idea of what you're in for.
View attachment 877134
CarolynFH
DIS Legend
- Joined
- Jan 5, 2000
- Messages
- 20,828
I think it’s been the opposite, at least since the Aulani debacle (https://dvcnews.com/dvc-program-men...ntinel-aulani-dues-error-lead-to-lewis-ouster). Dues for CCV and for RIV surprised people when they first went on sale, but they didn’t increase as rapidly as the older resorts over their first few years, and now they’re not out of line with others.As far as CFW, I think what shocked many is that they are STARTING with such high MF's. Usually when DVC brings a new resort they try to keep the MF's low (at least from the start), to encourage new buyers
That said, the initial CFW dues are shockingly high. So it will be interesting to see how they change in the coming years.
BTW, it is not directly a function of building type & construction, but in addition to transportation responsibility (Skyliner was mentioned here earlier), I wonder about the cost of caring for the animals at AKV (the costs of maintaining the Savanahs) and what will most certainly be built in there as an ongoing charge...I don't know about projecting accurately but I've done some work on tracking historic MF changes.
Feel free to take a look at my Google Sheet -- and make your own copy if you want! I'll summarize some of the data and include some charts here, but they'll be blurry, so you can click-through for higher-resolution versions, and make your own copy to play around with variables.
https://docs.google.com/spreadsheets/d/12UuW8kj1JsUG-M16dHppNFc_in0Mic-b5qpszwZ17vY/edit?usp=sharing
The 'Detail' page tracks annual changes for each resort and calculates the historic Compound Annual Growth Rate (CAGR). For resorts that have been open long enough, it also splits out the CAGR for the first five years, last five years, and middle years (excluding first five and last five). At most resorts the growth rate is slow for the first 4-5 years before there are material increases, so that's there as a reminder not to look at a limited dataset and assume that, for example, RIV will always have due increases half the WDW average.
View attachment 877128
There are also some visualizations of changes per resort.
This chart shows the % change by year, so you can see how much dues at each resort have grown since opening. This visualizes how BLT dues growth has been significantly above-average, doubling in its first 15 years. BWV has been consistently below-average, taking 25 years to double its opening dues. SSR saw relatively little dues growth through the first 15 years, but is now somewhat above-average relative to opening-year dues.
View attachment 877132
This chart shows the dues in dollars, from each resort's opening to the current year, along with an average (black line).
View attachment 877133
This chart projects dues (in dollars, log scale) out to the end of each resort. This uses the "Proj. CAGR" value for each resort in the Detail slide (row 45), which is something I just filled in as a guess based on historic data, usually in the 4.0% to 4.5% range. Obviously there's no chance these will end up being perfect straight lines, but it gives a rough idea of what you're in for.
View attachment 877134
atthebeachclub
DIS Veteran
- Joined
- Apr 18, 2024
- Messages
- 1,972
Great info. I am curious as to whether some of this is due to mispricing when first released. BLT dues appear to have been far too low at first. And they were selling the place during a recession, so maybe that was intended. Does it truly cost more to maintain the location, or is it just a case of catching up to actual costs? Because the dues have increased, but are still some of the lowest at WDW.I don't know about projecting accurately but I've done some work on tracking historic MF changes.
Feel free to take a look at my Google Sheet -- and make your own copy if you want! I'll summarize some of the data and include some charts here, but they'll be blurry, so you can click-through for higher-resolution versions, and make your own copy to play around with variables.
https://docs.google.com/spreadsheets/d/12UuW8kj1JsUG-M16dHppNFc_in0Mic-b5qpszwZ17vY/edit?usp=sharing
The 'Detail' page tracks annual changes for each resort and calculates the historic Compound Annual Growth Rate (CAGR). For resorts that have been open long enough, it also splits out the CAGR for the first five years, last five years, and middle years (excluding first five and last five). At most resorts the growth rate is slow for the first 4-5 years before there are material increases, so that's there as a reminder not to look at a limited dataset and assume that, for example, RIV will always have due increases half the WDW average.
View attachment 877128
There are also some visualizations of changes per resort.
This chart shows the % change by year, so you can see how much dues at each resort have grown since opening. This visualizes how BLT dues growth has been significantly above-average, doubling in its first 15 years. BWV has been consistently below-average, taking 25 years to double its opening dues. SSR saw relatively little dues growth through the first 15 years, but is now somewhat above-average relative to opening-year dues.
View attachment 877132
This chart shows the dues in dollars, from each resort's opening to the current year, along with an average (black line).
View attachment 877133
This chart projects dues (in dollars, log scale) out to the end of each resort. This uses the "Proj. CAGR" value for each resort in the Detail slide (row 45), which is something I just filled in as a guess based on historic data, usually in the 4.0% to 4.5% range. Obviously there's no chance these will end up being perfect straight lines, but it gives a rough idea of what you're in for.
View attachment 877134
CarolynFH
DIS Legend
- Joined
- Jan 5, 2000
- Messages
- 20,828
My understanding is that there’s a line item in the AKV budget for animal care.BTW, it is not directly a function of building type & construction, but in addition to transportation responsibility (Skyliner was mentioned here earlier), I wonder about the cost of caring for the animals at AKV (the costs of maintaining the Savanahs) and what will most certainly be built in there as an ongoing charge...
CarolynFH
DIS Legend
- Joined
- Jan 5, 2000
- Messages
- 20,828
See my post #29 above. BLT opened before AUL (2009 vs. 2011), and Jim Lewis was already DVC VP, IIRC.Great info. I am curious as to whether some of this is due to mispricing when first released. BLT dues appear to have been far too low at first. And they were selling the place during a recession, so maybe that was intended. Does it truly cost more to maintain the location, or is it just a case of catching up to actual costs? Because the dues have increased, but are still some of the lowest at WDW.
IOW, after AUL DVC tended to overestimate dues when opening a new resort.
disneylandtour
DIS Veteran
- Joined
- Oct 7, 2006
- Messages
- 1,387
One way to look at this is O&E costs. Resorts with a lot of land (such as AkV and OKW) have more upkeep, which I think is reflected in the overall yearly MF. Personally, I think that BLT, over time, is going to be one of the cheapest MF resorts in FL: it has one building, one roof, small pool, no significant restaurant, minimal grounds and landscaping, shared transportation with the Contemporary. The increases here almost surely have to be smaller than resorts with more land (Poly, AKV, etc.) and with more or larger amenities such as RIV. Also, hurricane damage to a single high-rise is less likely to be significant than with individual and smaller structures, such as at OKW. And yes, you can see by my signature that I have both OKW and AKV (along with BLT). The cost savings of the value rooms at AKV more than offset the higher MFs IMO--and I stay there often. And as for OKW--well, there was an extended contract during the pandemic that was really, really cheap and I do find the place very chill--but if I was paying market value for OKW now at resale, I'm not sure I'd buy there again.
Cabius
More Disney-obsessed than is healthy.
- Joined
- Nov 22, 2017
- Messages
- 1,574
Great info. I am curious as to whether some of this is due to mispricing when first released. BLT dues appear to have been far too low at first. And they were selling the place during a recession, so maybe that was intended. Does it truly cost more to maintain the location, or is it just a case of catching up to actual costs? Because the dues have increased, but are still some of the lowest at WDW.
As @CarolynFH points out, DVC had leadership (pre-Aulani that estimated dues too low in order to entice sales, and has since cleaned that up. Now, I don't know if they are estimating too high now. But based on what happened in Aulani, I think it's a reasonably safe assumption that they underestimated costs, had to raise dues more aggressively for a number of years to catch up, and have settled into something more normal.
Comparing changes dues at BLT vs at the six pre-BLT resorts, you can see that BLT dues increased at a notably higher rate from 2010 to 2018 (5.47% vs 3.37%). Since 2018, though, BLT dues have increased at a slightly lower rate (about 4.25% vs 5.17%).
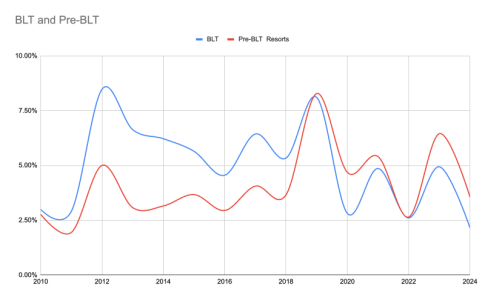
But BLT dues started out super low -- $3.67/point vs an average of $4.86 at the prior six resorts! So even though BLT dues rose at a higher rate, they still haven't caught up with the any of the prior six resorts. The price difference narrows from 2010 to 2018, and then widens again thereafter.
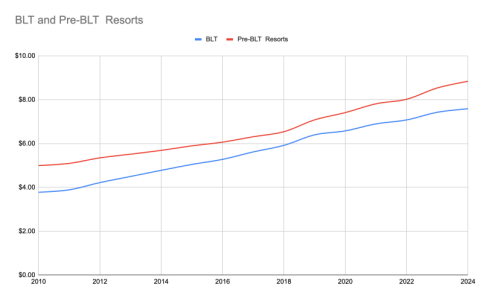
I do suspect that BLT will be a good low-dues option long term, for the reasons @disneylandtour outlines. It has the highest CAGR of the first 7 resorts, but I really think that was a one-time catch-up. Over the past 5 years, they've been on the low-end. (BRV has actually seen slower growth in dues, but also sits just about the WDW average in dollar terms.)
Could you please explain? Does that mean there is a cap on MF increases due to veterinary care, grazing land etc. in the future or not? Not sure I understand if that helps or hurts future MF's..My understanding is that there’s a line item in the AKV budget for animal care.
CarolynFH
DIS Legend
- Joined
- Jan 5, 2000
- Messages
- 20,828
I don't own AKV and don't have access to its budget. I honestly don't know whether animal care comes under the limitations for increases.Could you please explain? Does that mean there is a cap on MF increases due to veterinary care, grazing land etc. in the future or not? Not sure I understand if that helps or hurts future MF's..
- Joined
- Nov 15, 2008
- Messages
- 47,949
I may understand a section of Monorail or Skyliner responsibility, but Just because the boat or bus STOPS somewhere, the owners are on the hook for MF's? Seems to me that a bus can stop ANYWHERE and change routes (as can a boat if a resort is near water).
Now I could understand the bus stop or dock itself being billed to the resort, but how much does it cost to build and maintain a dock (or a bus stop)? IMO it does not seem like a great deal of money..
Owners will always be responsible for their share of transportation costs that service the resort to/from the parks. So, if it costs a resort (making it up) 1 million a year to have buses bring guests to/from the parks every single day, then owners at that resort, whether shared or hotel, will pay a portion of that bill.
It is not just the construction of the dock or bus stop, etc. Its the operation to run it do, so CM's salarys, gas, purchase of vehicles, etc. When it is a shared resort, the "share" that DVC owners have to pay can be determined in a certain way...and one way is occupancy levels at the resort (how many rooms are DVC vs. cash).
Its not just tranportation either, its any expenses at the resort. PVB owners pay their share to maintain the entire complex, including areas that are around the cash side....
But, with the shared hotels, if Disney decided they wanted to add an enhanced transportation option to service their hotel, then DVC owners, by default would have to absorb their share of operating costs for that transportion.
- Joined
- Nov 15, 2008
- Messages
- 47,949
The operating costs for a resort have a cap of 15% per year maximum (never come close). For AKV, the cost for animal care would fall under that...and its not a line by line cap, it is total...so, if animal care rose 20% one year, but the rest only rose 5%, the total would be below that cap.Could you please explain? Does that mean there is a cap on MF increases due to veterinary care, grazing land etc. in the future or not? Not sure I understand if that helps or hurts future MF's..
Cabius
More Disney-obsessed than is healthy.
- Joined
- Nov 22, 2017
- Messages
- 1,574
I don't own AKV and don't have access to its budget. I honestly don't know whether animal care comes under the limitations for increases.
Animal Programs are itemized at $0.4648 (7.4% of operating costs or 5.1% of total total dues).
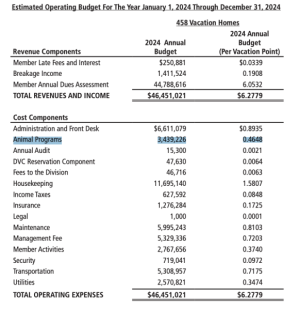
Edit: Sandisw addressed the operating expense cap while I was typing this out.
-
Disney Doesnt Care About Figment, Only Your Money
-
Limited Time: New Cream Cheese Stuffed Gingerbread Cookie
-
Disney World's Best Christmas Lights are at EPCOT
-
What Your Favorite Magic Kingdom Ride Says About You
-
New Disney Merch: T-Shirts, Ears, Towels&More!
-
Cinderella Castle's Repainting Project Starts in January at Magic Kingdom
-
New 'Disney Unscripted' on Disney Destiny Ship
New Threads
- Replies
- 0
- Views
- 55
- Replies
- 13
- Views
- 347
- Replies
- 4
- Views
- 122
- Replies
- 3
- Views
- 198
New Posts
- Replies
- 22
- Views
- 2K
- Replies
- 13
- Views
- 347
- Replies
- 4
- Views
- 192
- Replies
- 206
- Views
- 27K
- Poll
- Replies
- 35
- Views
- 1K


