TouringPlans Crowd Calendar Mini-Review
So, I've already subscribed to TP and booked my trip based on their predictions, so I'm locked in regardless of their accuracy. This little exercise of mine was purely out of curiosity, because I had some free time, and to help anyone considering them.
Since August 12, 2014, they have published their predictions vs. actual park levels measured after the fact. I went ahead and noted all measured vs. predicted levels on each day since then. Keep in mind, according to their website, their crowd calendar is based solely on wait times for many attractions, rather than something like number of people physically in the park. I took all the info, graphed it, and analyzed it.
Also, I would like to point out, all of the data I used for this analysis is publicly available, and does not require a subscription to access. Every week they post a public blog entry showing their predictions for every day and what they saw for every day.
Here's my observations:
---------------------------------
They posted on their blog that the predictions are from crowd levels from 2006 to now. HydroGuy makes a good observation in another thread:
So, I've already subscribed to TP and booked my trip based on their predictions, so I'm locked in regardless of their accuracy. This little exercise of mine was purely out of curiosity, because I had some free time, and to help anyone considering them.
Since August 12, 2014, they have published their predictions vs. actual park levels measured after the fact. I went ahead and noted all measured vs. predicted levels on each day since then. Keep in mind, according to their website, their crowd calendar is based solely on wait times for many attractions, rather than something like number of people physically in the park. I took all the info, graphed it, and analyzed it.
Also, I would like to point out, all of the data I used for this analysis is publicly available, and does not require a subscription to access. Every week they post a public blog entry showing their predictions for every day and what they saw for every day.
Here's my observations:
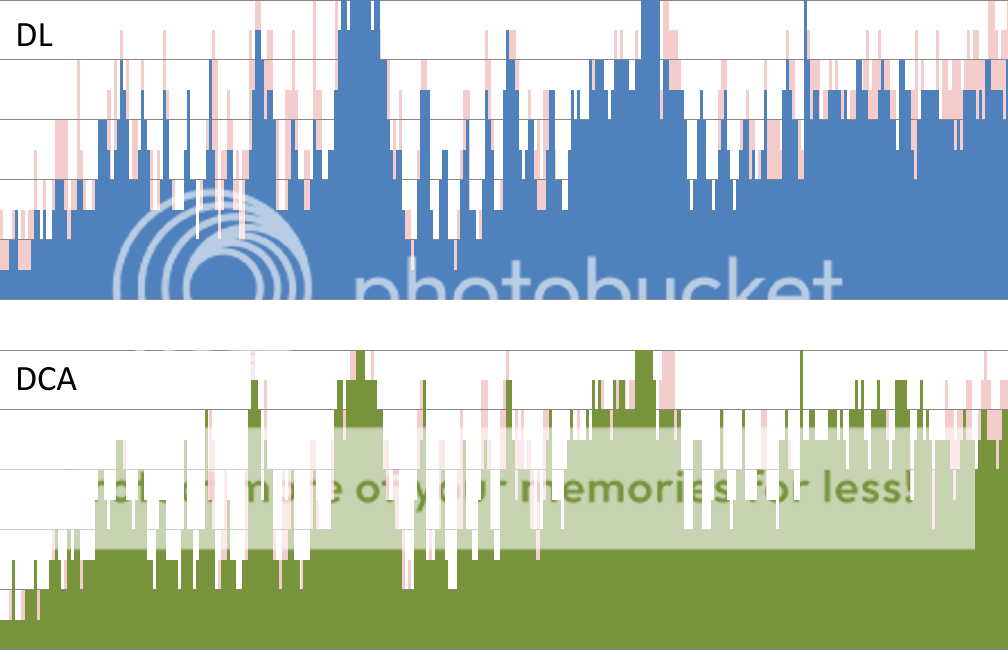
- On average, they underestimate the crowd level by 0.8 for Disneyland, and 0.4 for California Adventure. This number only includes days that they underestimate - days that they overestimated (was less busy than they predicted) are considered a 0, or "got it right."
- Overall, that's not too bad. There are some caveats, though, explained below.
- The accuracy is somewhat erratic. In the last 6 months, there are many days both overestimated and underestimated. Many days jump back and forth from day to day. Any given 7 day period has days underestimated as well as overestimated or even. The only exception I saw was DL at the start of Holiday season, and almost the whole month of July this year.
- They seem to have issues with the 'seasons' of Disneyland (CA is better). In Halloween season last year, they only overestimated by 1 level, and on a handful of days, while they underestimated by 2, 3, and 4 crowd levels quite a few times. Similar trends were seen during Christmas season, and this year’s summer season (Diamond Celebration). The start of Spring Break was underestimated by 3's and 4's, but they did a pretty good job on the rest of it, though.
- They also seem to have issues with holidays. Labor Day was underestimated by 4. Columbus day was underestimated by 2. Veterans Day was on a Tuesday last year, and they underestimated the Monday before by 4, and the day of by 5. Thanksgiving and the day after were underestimated by 2. Christmas and New Years were pretty accurate, but they were predicting 9's and 10's, so not much room to be under.
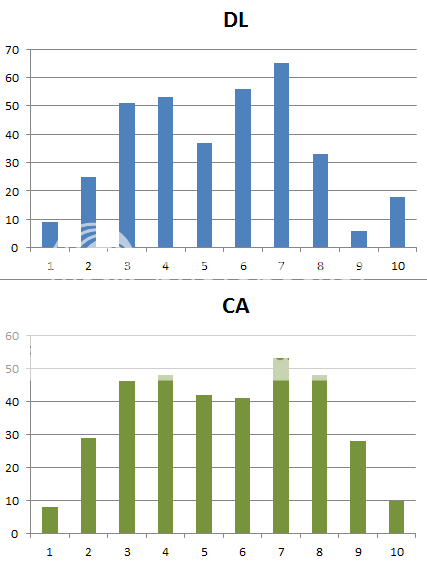
- The maximum underestimation for DL was a 5 on two days, and for DCA a 4 on just one day.
- There were 6 days underestimated by 4 and 11 days underestimated by 3 for DL, and 12 days underestimated by 3 for DCA.
---------------------------------
They posted on their blog that the predictions are from crowd levels from 2006 to now. HydroGuy makes a good observation in another thread:
If Disneyland is getting busier and busier every year, especially during the 'off-seasons,' then including levels from 2006 in the prediction will average them down lower than where they should be. So this could very well be why they have a trend of underestimation.I am sorry, I just could not care less how crowds tomorrow compare to crowds in 2006. And I doubt anyone else cares either. When I am choosing days to visit DLR or WDW and attempt to use a crowd calendar I want to know if I am going at a busy or less busy time of that year compared to other days in that year. Comparing 2015 to 2006 is absurd.

 ). That's exactly what happens -- there is a mass exodus of people from the days or weeks that would ordinarily be crowded, and they all head over to the time frames that are supposedly less crowded -- which, in turn, makes the less crowded times more crowded, and the formerly super crowded times become less crowded. Then it all eventually shifts in the opposite direction again!
 ")